Debugging with Visual Studio Code, XDebug and Docker on Windows
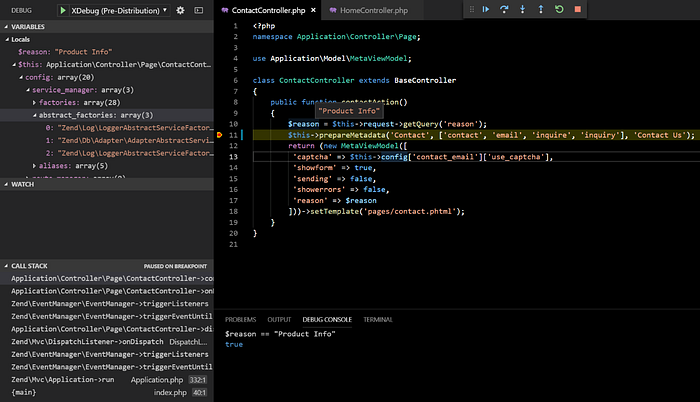
This article explains how to configure a robust coding and debugging environment on Windows 10 using Microsoft Visual Code, Docker for Windows, XDebug and Felix Becker’s excellent Visual Code extensions to support PHP Debugging and IntelliSense.
Here’s what is in this article:
- Introduction to the Stack
- Installing the Stack
- Debugging Hello World

Updates (January 2021)
Since folks are still reading this article, I’ve updated it to include the following:
- Updated to work with XDebug 3
- Added commands to enable
host.docker.internalfor Linux (even though Docker 20 supportshost-gateway, not all Linux distributions are on 20 at the time of this update). All this does not break compatibility with Windows or Mac.
Introduction to the Stack
- Visual Studio Code is a cross-platform code editor that is fast, tight yet has very robust language support. Microsoft regularly releases updates (about monthly) and is continually adding new features. It is open source, free and has an active community supporting it. It’s one of the few applications you’ll genuinely look forward to the updates.
- Docker for Windows is a godsend for anybody who works on a Windows machine but runs their application on a Linux host, especially those that support deploying Docker images (in my case, including Amazon Web Services). You can easily replicate your hosting environment, including things like memcache that aren’t available on Windows. It makes me more productive because I don’t have to spend time building schizophrenic behavior into my applications (“what am I running on?” “is this library available?” “what version of PHP am I running?” etc.).
- XDebug and the PHP Debug extension facilitate breakpoint support and variable inspection, is way more productive for me than adding a bunch of logging breadcrumbs.
Installing The Stack
- Install Docker for Windows: If you are on Windows 10 or version that supports Hyper-V, enable that. It’s much leaner than the older Virtual Box version.
- Install PHP locally in Windows: The Visual Code extensions rely upon PHP running locally in Windows, your application code will not be using this version of PHP. If you don’t have PHP on Windows already, download the most current PHP Non Thread Safe version from this page. Add the directory containing php.exe to your path. Make sure you can run “php -version” from a new command prompt.
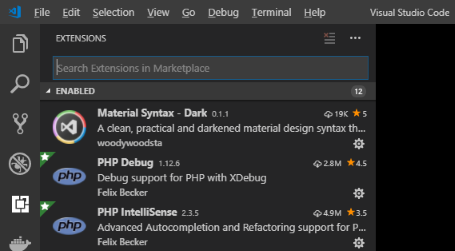
- Install Visual Code and extensions: Once you install Visual Code, click on the Extensions icon on the left and install the PHP Debug and PHP IntelliSense extensions from Felix Becker. Strictly speaking, you can debug without the PHP IntelliSense extension, but it’s very nice to have.

Debugging Hello World
Here is how to create a working Docker container that you can debug using XDebug in Visual Studio Code.
Set up an empty Visual Studio Code folder
Create an empty folder, it can be anywhere on a local drive that Docker will be able to access (not on a network share).
Open Visual Studio and use File, Open Folder to access the empty folder.
Create a “Hello World” PHP file
Create a sub-directory called src and a file within called index.php. Enter in this exciting application:
<?php
$s = "Hello World!";
echo $s;
Create a Dockerfile
In the main folder (not src) create a new file, call it Dockerfile, and enter in the following:
FROM php:7-apache# Install XDebug
RUN pecl install -f xdebug \
&& echo "zend_extension=$(find /usr/local/lib/php/extensions/ -name xdebug.so)\nxdebug.mode=debug\nxdebug.start_with_request=yes" > /usr/local/etc/php/conf.d/xdebug.ini;# Install net-tools which we'll need to set up host.docker.internal for Linux,
# you can do docker-php-ext-configure and docker-php-ext-install and install
# other dependencies as required here
RUN apt-get update \
    && apt-get install -y net-tools \
    && apt-get clean# Set up entrypoint enabling host.docker.internal for Linux
COPY ./entrypoint.sh /usr/bin/entrypoint.sh
RUN chmod 777 /usr/bin/entrypoint.shENTRYPOINT ["/usr/bin/entrypoint.sh"]
CMD ["apache2-foreground"]
This Docker file pulls in the official image for PHP 7.4 Apache and does the following:
- Installs XDebug using PECL
- Creates a configuration file so the XDebug extension is active
- Install tools and overrides entrypoint.sh so that
host.docker.internalworks on Linux
Create Custom Entrypoint
In the main folder (not src) create a new file, call it entrypoint.sh, and enter the following:
#!/bin/bash# Trick to get host.docker.internal working on Linux Docker
# From https://dev.to/bufferings/access-host-from-a-docker-container-4099
HOST_DOMAIN="host.docker.internal"
ping -q -c1 $HOST_DOMAIN > /dev/null 2>&1
if [ $? -ne 0 ]; then
    HOST_IP=$(route | awk 'FNR==3 {print $2}')
    echo -e "$HOST_IP\t$HOST_DOMAIN" >> /etc/hosts
fi# Copy in original PHP docker-php-entrypoint
set -e# first arg is `-f` or `--some-option`
if [ "${1#-}" != "$1" ]; then
 set -- apache2-foreground "$@"
fiexec "$@"
In this entry point, we check to see if host.docker.internal resolves and, if not, create an /etc/hosts entry for it. We then execute the default entry point behavior for the PHP Apache image.
Create a Docker Compose file
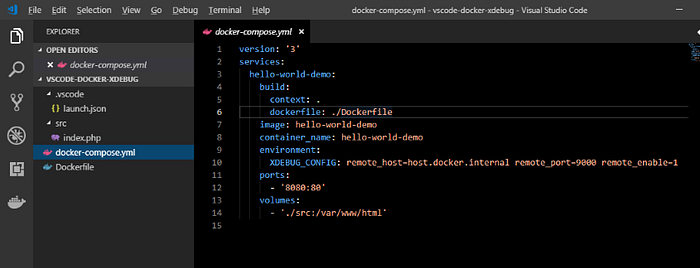
In the main folder (not src) create a new file, call it docker-compose.yml, and enter in the following:
version: '3'
services:
  hello-world-demo:
    build:
      context: .
      dockerfile: ./Dockerfile
    image: hello-world-demo
    container_name: hello-world-demo
    environment:
      XDEBUG_CONFIG: client_host=host.docker.internal client_port=9000
    ports:
      - '80:80'
    volumes:
        - './src:/var/www/html'
This is pretty simple, but there are a couple of things in mind:
- The XDEBUG_CONFIG environment variable values enable remote debugging and sets the address and the port that the PHP XDebug extension will use to connect to the debugger running in Visual Code Studio. This may seem a little backward if you are not familiar with remote debugging — remember, XDebug is connecting to the editor/debugger, not the other way around. Also, host.docker.internal is a reserved host entry for Docker for Windows and Mac to allow a container to communicate with the host — if you set this to localhost then XDebug will not be able to reach you outside of the container PHP is running in.
- The volumes entry maps the src directory (which has the index.php file in it) to the directory set up as the Apache home folder in the PHP Docker base image we are pulling into our Dockerfile. The relative path here is fine, do not use fully qualified paths (drive, directory, etc.).
- We’re exposing port 80. If you have something else running on port 80 and need to leave it running, you can change the first number of the ports entry (ex. ‘8080:80’)
Set up the Debugging Task
You will need to create a debugging task for PHP. In Visual Studio Code, pull down the Debug menu and select “Add Configuration”. If you have the PHP Debug Extension installed, you will have an option in the list for “PHP”. Select it.
By default, there are two entries created. The first, “Listen for XDebug” is the one you’ll need. The second, “Launch currently open script” you will not use, at least here. You’ll want to update the entries as follows:
{
    "version": "0.2.0",
    "configurations": [
        {
            "name": "Listen for XDebug",
            "type": "php",
            "request": "launch",
            "port": 9000,
            "pathMappings": {
                "/var/www/html": "${workspaceFolder}/src"
            },
            "xdebugSettings": {
                "max_data": 65535,
                "show_hidden": 1,
                "max_children": 100,
                "max_depth": 5
            }
        }
    ]
}
Here are some things to pay attention to:
- The port number has to match what’s in your XDEBUG_CONFIG set up in your docker-compose.yml file.
- The path mappings need to be correct. Do not use drive letters, do not use relative paths, or anything other than ${workspaceFolder} to map to your files.
- The other xdebugSettings I put in to help ensure I can drill down when inspecting arrays and such. You can tweak these values to your liking (make them too big, things bog down).
Final Check

You should have four files at this point:
- docker-compose.yml
- Dockerfile
- src/index.php
- .vscode/launch.json
Debug!
Finally, the payoff…
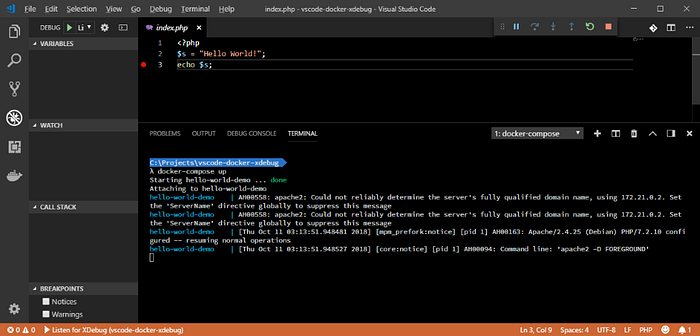
Open up the index.php file. On line 3, click to the left of the “3” and you should get a red dot. That’s a breakpoint.
Open a terminal window (View / Terminal) and run docker-compose up

Open up a browser and browse to http:localhost (if you changed the port in docker-compose.yml, don’t forget that). The browser, hopefully, will “freeze” and not show anything. That is because Visual Studio Code is paused and waiting for you to continue past the breakpoint. At this point, you can view the $s variable in the debug pane, hover over the variable in the code to see the value, and execute PHP evaluations in the Debug Console (including modifying locally scoped variables).
You can hit F5 to keep going and render the page.

Getting Help
- Use the gitter for the PHP Debug extension to ask general questions or see if other people are running into the same problems you are
- If you think you have a legitimate bug, check the GitHub issues list for the PHP Debug extension
- If you think you are having issues with Docker for Windows, check their GitHub issue list
Troubleshooting
Debugging doesn’t break on exceptions
- In the bottom of the Visual Studio Debug pane, make sure you have the correct options checked
- You may have a mismatch between the port defined in XDEBUG_CONFIG and your debugger settings in launch.json
- XDebug did not install properly when you were building your Dockerfile
- You may be running into a very rare occasion where a specific version of XDebug is having problems with the PHP Debug extension, check
Debugging stops on exceptions but doesn’t open the right file, and/or it does not stop on breakpoints
- Most of the time, it’s because your pathMappings entry is wrong, make sure you are using ${workspaceFolder} and not typing in drive letters; recent versions of Visual Studio Code allow you to have multiple entries, which makes it easier if you are mapping different directories in Apache
Variable inspection can’t drill down into Arrays
- Check xdebugSettings in launch.json
Debugging for things Websockets and Spawned PHP processes doesn’t work
- I’ve run into this with things like Ratchet websockets and spawning PHP processes from my PHP application. I don’t know much of a workaround for this
- One thing to note, and kind of related, that is cool is that you can have multiple containers, each with XDebug set to its own port, and create different launch.json profiles for them, and have them run simultaneously.
Acknowledgements and Thanks
- Felix Becker for building and maintaining the extremely useful add-ins that make Visual Studio Code a viable PHP editor
- Microsoft for making one of the most powerful, extensible and fun editors I’ve used in quite a while
- The Docker for Windows team for building a great tool and remembering that a lot of us do our work on Windows
